One of the most useful tools for a web developer is the Inspect Element tool. It allows you to quickly jump to the important part of the code to see what's going on there.
It's something I use probably more than any other tool.
The best part is it allows you to see what's going on in the final render of the web page.
If you're only looking at the backend, or in the style.css file, you might miss an important piece of code that completely changes how the user will see that part of the page.
How to open Inspect Element in Windows Browsers (Chrome, Firefox, IE): The process for all the browsers is the same in Windows. You right click and choose the one that starts with "Inspect".
Jump to the guide for your browser:
How to find code using Chrome Inspector
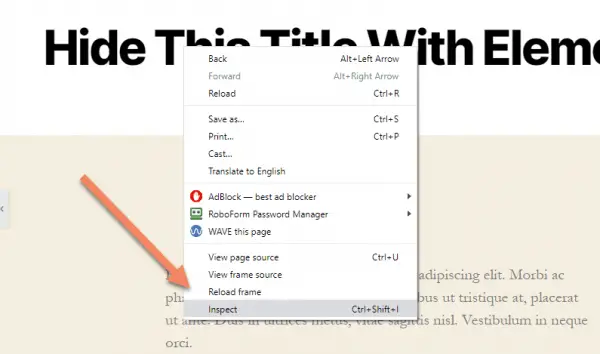
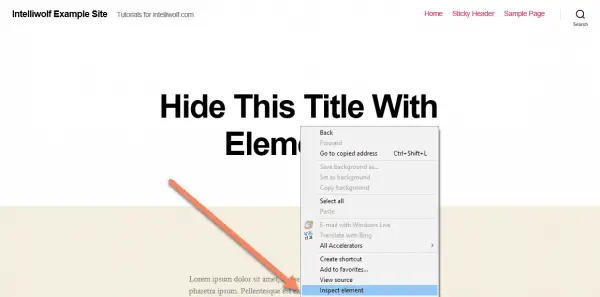
Right click on the part of the web page for which you want to see the source code, then click "Inspect".
Alternatively, to open the inspector without going to a particular part, press Ctrl + Shift + I.
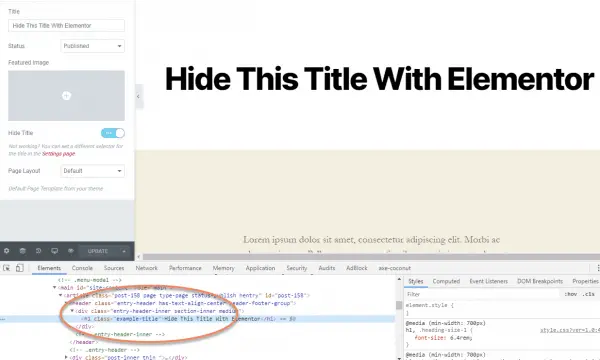
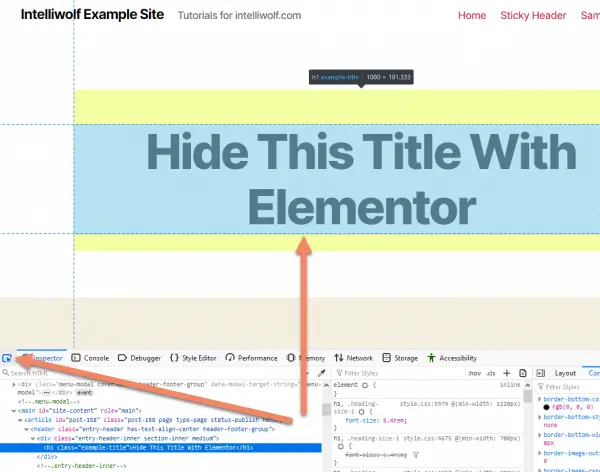
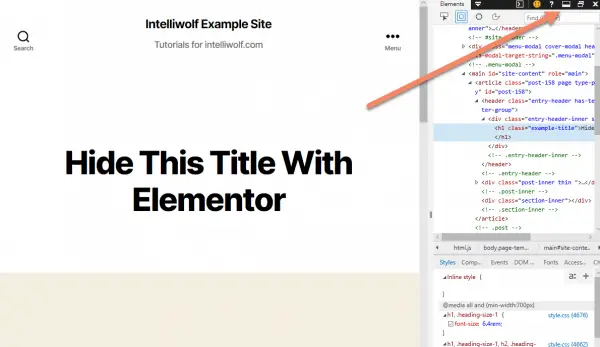
You'll see the Inspector somewhere on the page. It will likely dock to the bottom, but you can change the position by clicking the ellipsis (...) next to the X at the top of the Inspector window.
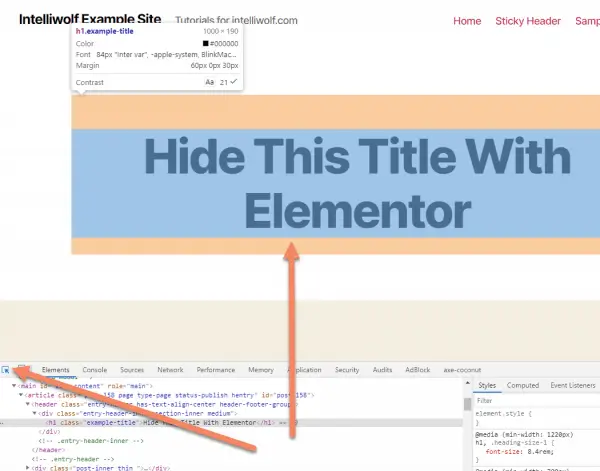
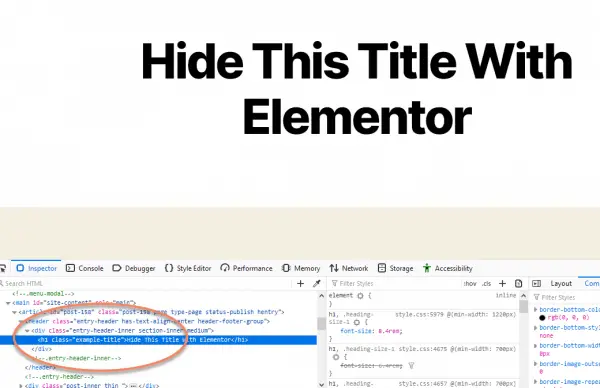
If you want to view a different part of the page, or you didn't quite click in the right spot, click the icon with the box and arrow at the top left of the Inspector, then hover your mouse over the area of the page you want to view. Left click when you're at the right spot.
You'll see the code position update to where you're hovering.
Alternatively, you could scroll through the code window, find and click the actual code you're after. This can be handy if there are positioning issues or you're dealing with a hidden element.
How to find code using Firefox Inspect Element
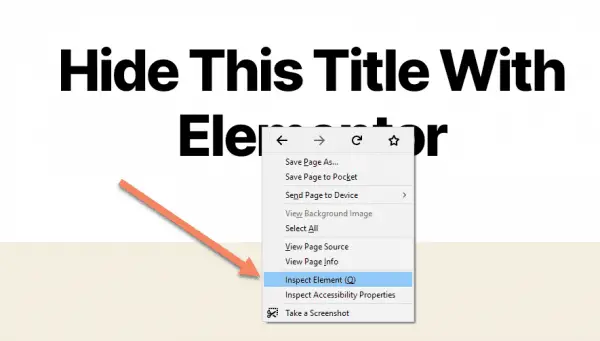
Right click on the part of the page you want to view and select "Inspect Element" from the popup.
You'll see the Inspect Element window, probably at the bottom of the browser window.
If you want to change the position of the Inspect Element window, click the ellipsis (...) on the top right of the window and choose your position.
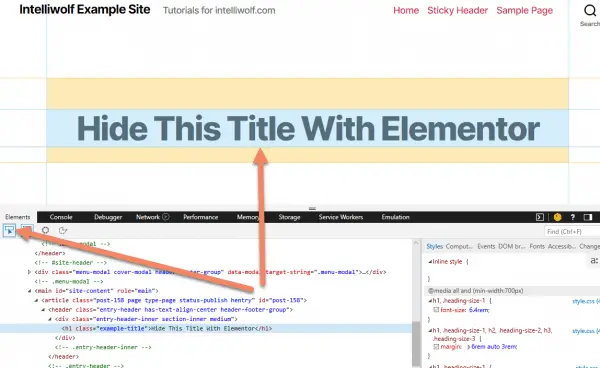
If you want to see a different part of the code, or you didn't click the right spot initially, click the icon with the square and arrow, then hover with your mouse until you get to the element you're after.
The code in the Inspect Element code window will move around in response to your mouse. Just left click when you're at the right spot to stop the highlighting.
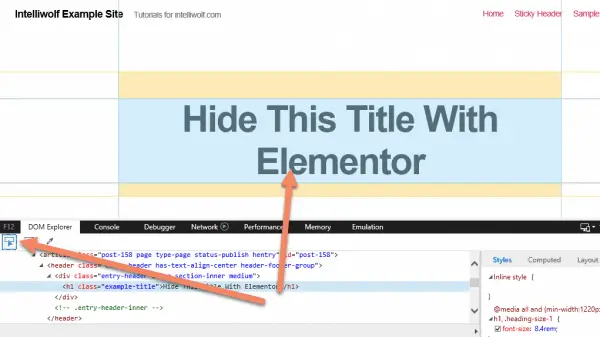
How to find code using Internet Explorer Developer Tools
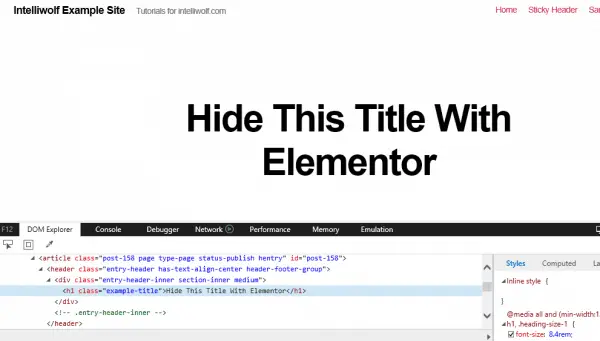
Right click on the area you want to view, then choose "Inspect element" from the popup menu.
Alternatively, with the Internet Explorer browser active (just click anywhere in the browser if it's not), hit F12 to pull up the Developer Tools.
If you've use Inspect element, you should see the code for that part highlighted.
To view other parts of the code, or if you got to Developer Tools using F12, click the icon with the rectangle and weird triangle in the top left corner of the Developer Tools window.
Move your mouse to hover over the area you want to see. It will update the position in the code window as you move your mouse around. Left click when you're at the right position.
How to get and use Microsoft Edge Developer Tools
With Microsoft Edge active (click anywhere in the browser if it's not), press F12 on your keyboard. That will open the Developer Tools and ask you if you want to add "Inspect element" to the popup menu.
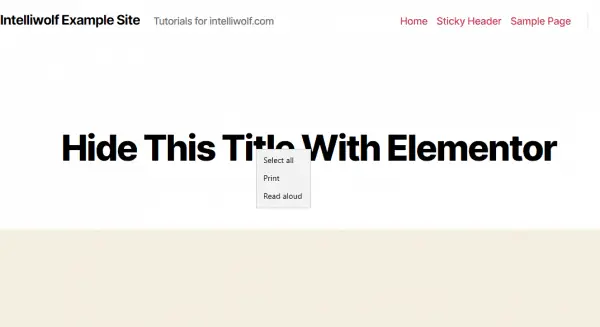
When you first open Microsoft Edge, if you haven't used Developer Tools before, you won't see Inspect element when you right click.
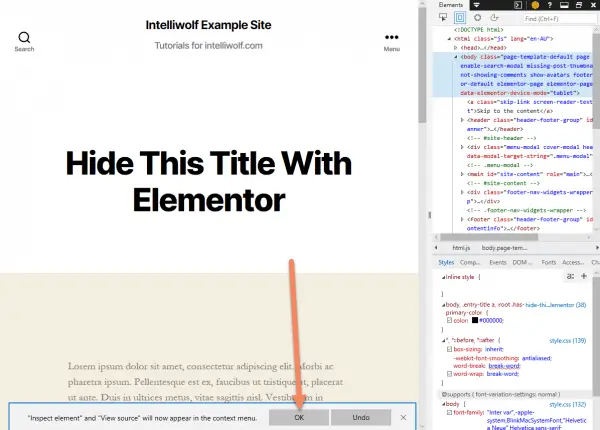
You have to press F12 on the keyboard. That will bring up Developer Tools as well as a bar at the bottom telling you that you can now use "Inspect element" in the context menu. Click "OK" to close that.
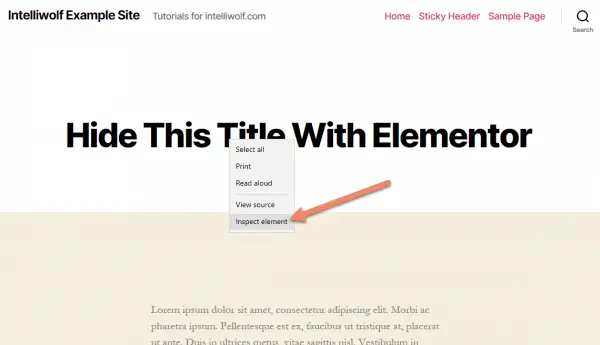
Now the next time you're in Microsoft Edge and right click on an element, you'll see "Inspect element".
The Developer Tools in Microsoft Edge docs to the right by default. I prefer it at the bottom. If you prefer that configuration, the button is in the top right of the Developer Tools window.
If you want to see different parts of the code, or if you got to the Developer Tools by pressing F12, click the icon with the rectangle and triangle to bring up the picker.
Move your mouse around over the page to get to the part you want to see. Left click it to turn off the picker.
You can also scroll through the code and click the part you're interested in.
How to find code using Inspect Element in Safari on Mac
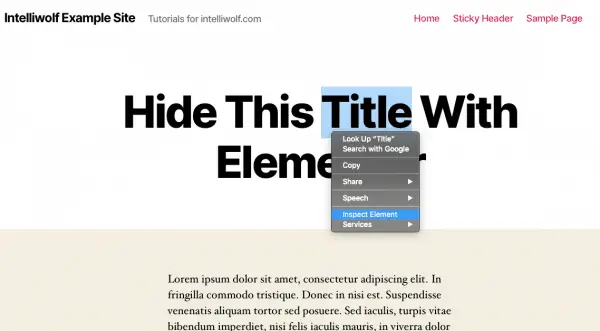
Hold Ctrl and click on the part of the website you want to view in code. Click "Inspect Element" to bring up the Inspector. Alternatively, press Alt+Cmd+I (⌥⌘I) to bring up the Inspector.
If you don't see that option, or the shortcut doesn't work, you'll need to enable the Developer Menu.
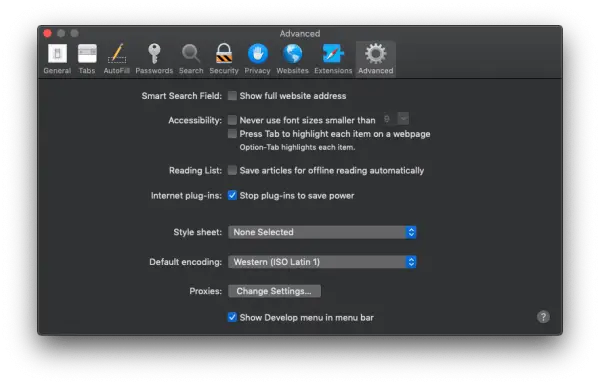
Go to Safari -> Preferences (⌘,):
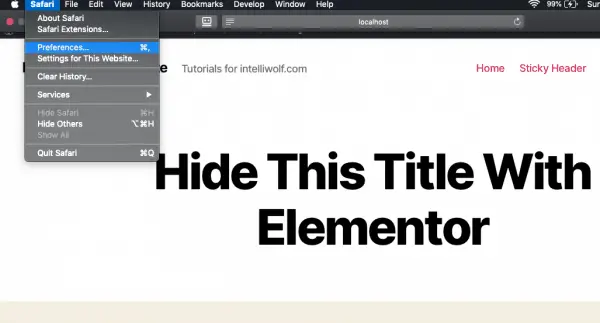
Make sure "Show Develop menu in menu bar" is checked. This will work with Safari 10 and above.
Once that's all sorted, try the ⌥⌘I combination again to bring up the Inspector.
You'll see the Inspector at the bottom of the screen in Safari. If you want to change the position of the Inspector, click one of the two icons on the top left of the Inspector, next to the x.
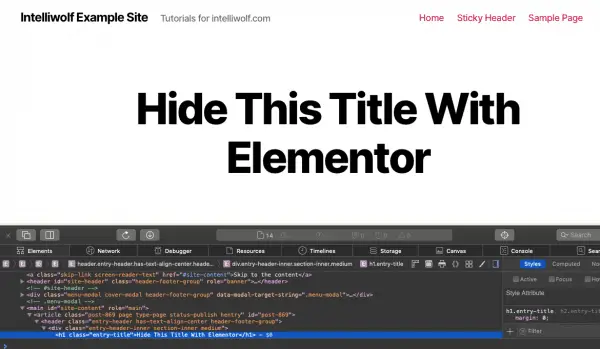
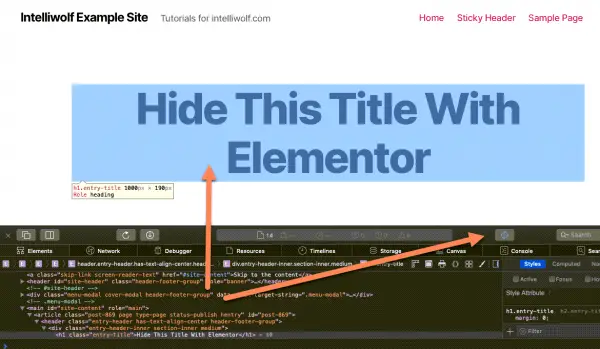
If you want to skip to a different part of the code, or you brought up the Inspector with the shortcut combination, click the scope icon in the top right of the Inspector window.
Move your mouse over the web page to get to the part of the code you want to see.

thanks this was a great help
thank you so much very helpful
GREAT WORK
thank you so much very helpful blog